对于销售公司,经常需要对销售业务数据进行分析总结,如下是一份销售明细:
包含了销售日期,商品,数量,金额,客单价字段

现在需要快速汇总每种商品销售的总金额,以及总数量,和对应的客单价水平情况
1、公式法首先,我们要列举出来有哪些商品
可以使用去除重复值公式
输入公式的是:=UNIQUE(TOCOL(B:B,3))
TOCOL第2参数填数字3,表示忽略空格和错误值
这样就去除了B列的空格
使用UNQUE公式,可以得到B列不重复值列表:

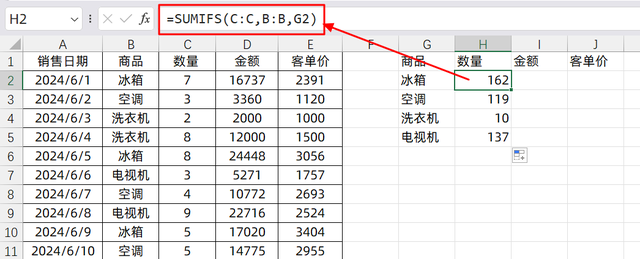
然后我们需要求对应的数量,可以使用
=SUMIFS(C:C,B:B,G2)
表示对C列求和,条件是B列里面对应G2的值
求解金额,也是同理,可以使用的公式是:
=SUMIFS(D:D,B:B,G2)
把求和区域换成了D列,条件不变

最后客单价,只需要使用总金额除以总数量即可,输入的公式是:
=I2/H2

有的小伙伴可能不太熟悉公式使用,那我们可以使用数据透视表法
2、数据透视表我们选中数据区域任意一个单元格,然后插入数据透视表
如下所示:

然后需要将商品字段放在行标签,将数量和金额字段放在值里面
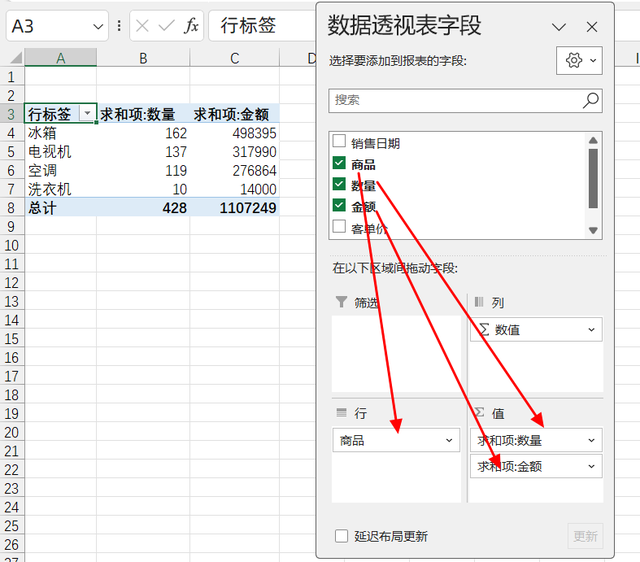
如果我们要求解客单价,我们不能将客单价字段直接拖入,改成平均值
这样求出的结果其实是不对的

以洗衣机为例:

所以在使用透视表计算均价的时候,不能拖入客单价字段,而是需要使用
数据透视表分析-字段项目和集,然后选择计算字段

然后在里面定义字段:均价,使用金额/数量
这样得到的结果才是正确的:

关于这个小技巧,你学会了么?你更喜欢用公式法还是透视表呢?